


In offshore work, the ocean doesn’t care about your schedule. When you’re running a cutter suction dredger or supporting a long discharge line far from shore, small issues escalate fast. A mild pressure swing becomes a sanding event. A minor air leak turns into unstable suction. A short communications blackout leads to a missed window, and the next weather front shows up right on time.
That’s why intelligent monitoring isn’t a “nice-to-have” dashboard. In real offshore dredging, it’s often the difference between steady production and a job that feels like constant firefighting. When an offshore crew talks about an intelligent dredging monitoring system, they’re not asking for more data. They’re asking for fewer surprises—early warnings, clearer root causes, and a way to make decisions with confidence when the line is long and the stakes are high.
This guide is written for project managers, dredge masters, mechanical engineers, and site supervisors who need offshore dredging to stay stable for weeks, not just for one smooth shift. You’ll see how a monitoring and control approach supports long distance dredging pumping, how it helps crews avoid pipeline incidents, and what “practical” looks like when you’re dealing with real slurry, real wear, and real offshore constraints.
Why offshore dredging needs intelligent monitoring, not just more manpower
The offshore reality: distance, weather windows, and limited troubleshooting time
Offshore projects punish guesswork. If you’re close to shore and your discharge line plugs, you might have spare equipment nearby, a quick tug assist, or a short trip to a workshop. Offshore, you may have none of that. You may have a single window before wind and swell increase, and you may have only what’s on deck.
The other offshore reality is that problems rarely show up as clean failures. They show up as drift. Production slips. Discharge pressure rises a little more each day. Density looks “fine” until it suddenly isn’t. The job still runs, but it runs worse. Without a way to track that drift early, the crew often responds late—usually after downtime has already happened.
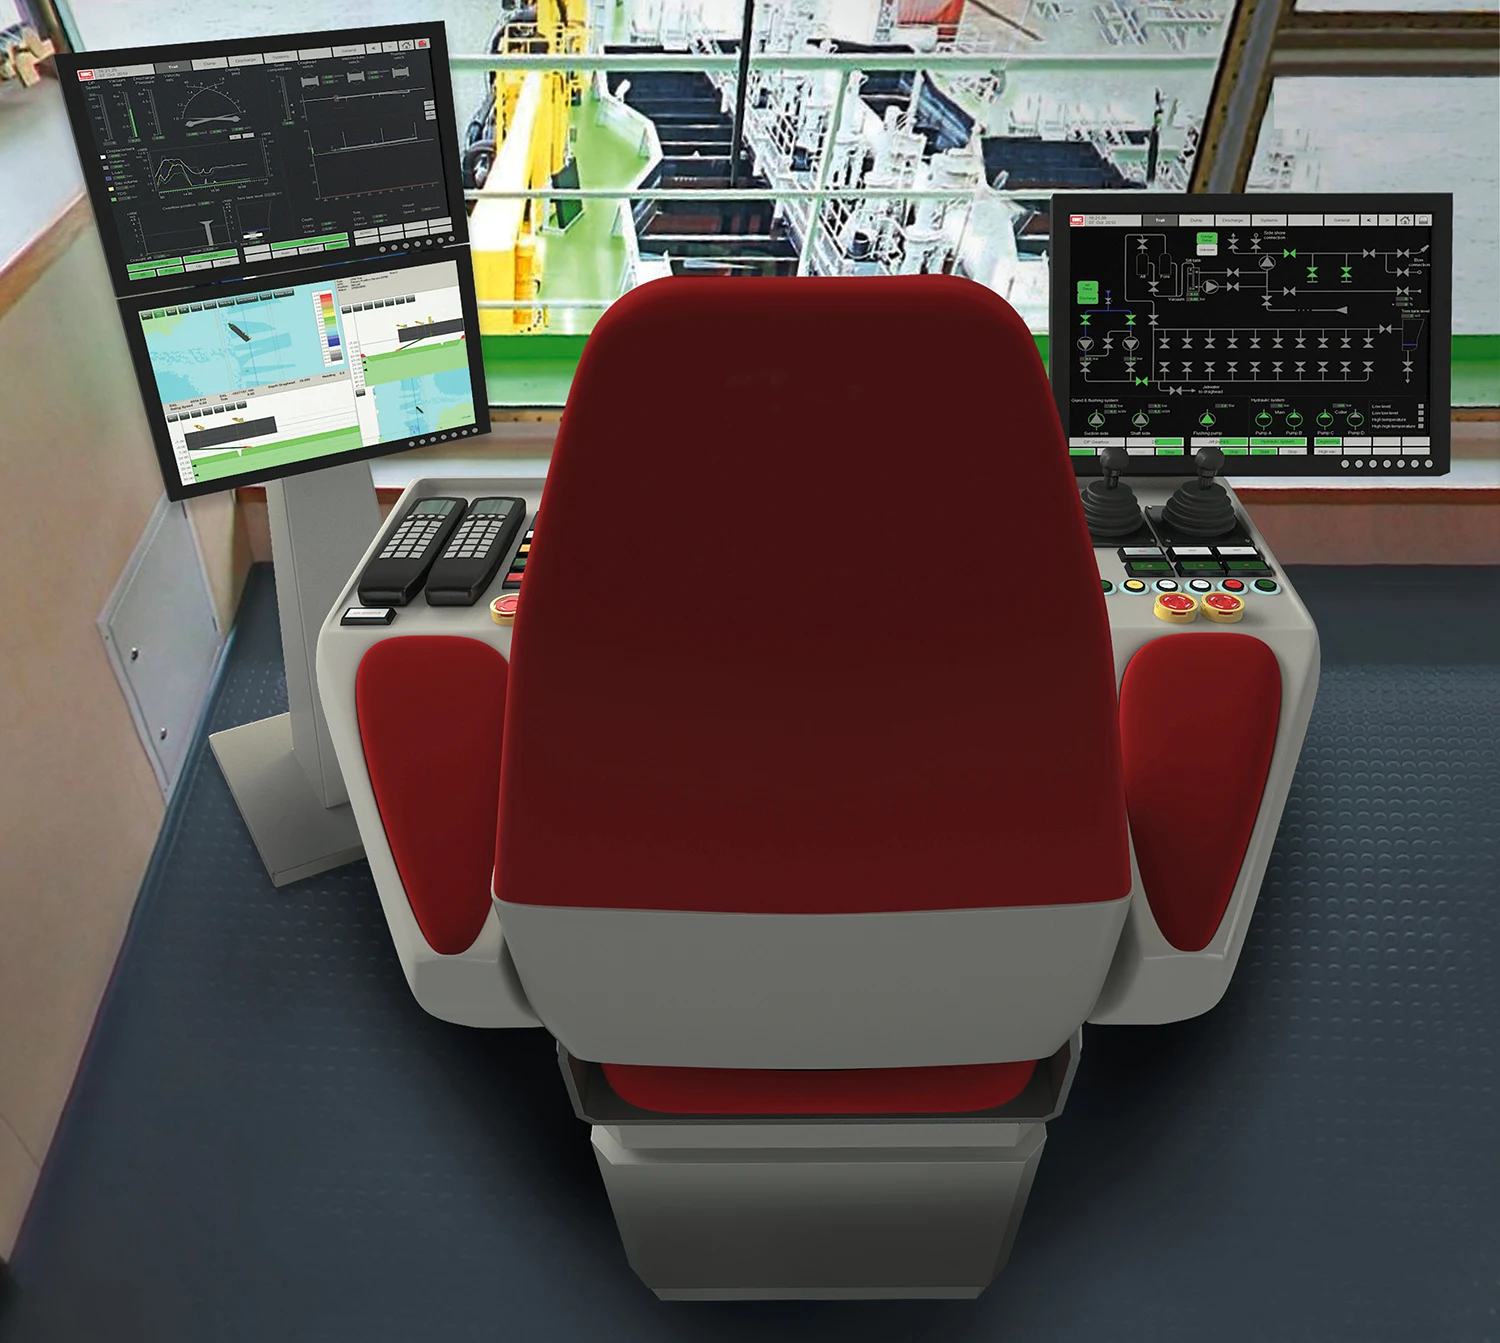
What “intelligent monitoring” means on a dredger: data you can act on in real time
A practical dredging monitoring system is not a wall of charts. It’s a small set of signals, captured reliably, that tell you what regime you’re operating in and how close you are to the edge. Offshore crews don’t need five hundred tags. They need the handful that answer the questions they ask during a shift:
Are we head-limited or velocity-limited?
Is this a wear problem or a pipeline problem?
Are we drifting toward cavitation, blockage, or water hammer?
If we change the operating point, what happens next?
When monitoring is set up around those questions, it becomes operational. The system stops being a reporting tool and starts being a decision tool.
The cost of blind operation: production loss, pipeline incidents, and unplanned downtime
Blind operation is expensive in two ways. The obvious cost is downtime. The less obvious cost is “hidden downtime,” where the dredger runs but production is low, fuel burn is high, and the crew is forced to dilute slurry just to keep the pipeline moving. Offshore, that hidden cost can quietly consume days. The job looks active, but progress on the client’s target volume falls behind.
A monitoring system helps by making the invisible visible. It gives you a baseline, then shows you how the system departs from that baseline, whether the cause is friction loss growth, suction instability, powertrain drift, or slurry transport conditions moving below critical velocity.
The core monitoring targets that actually move the project KPIs
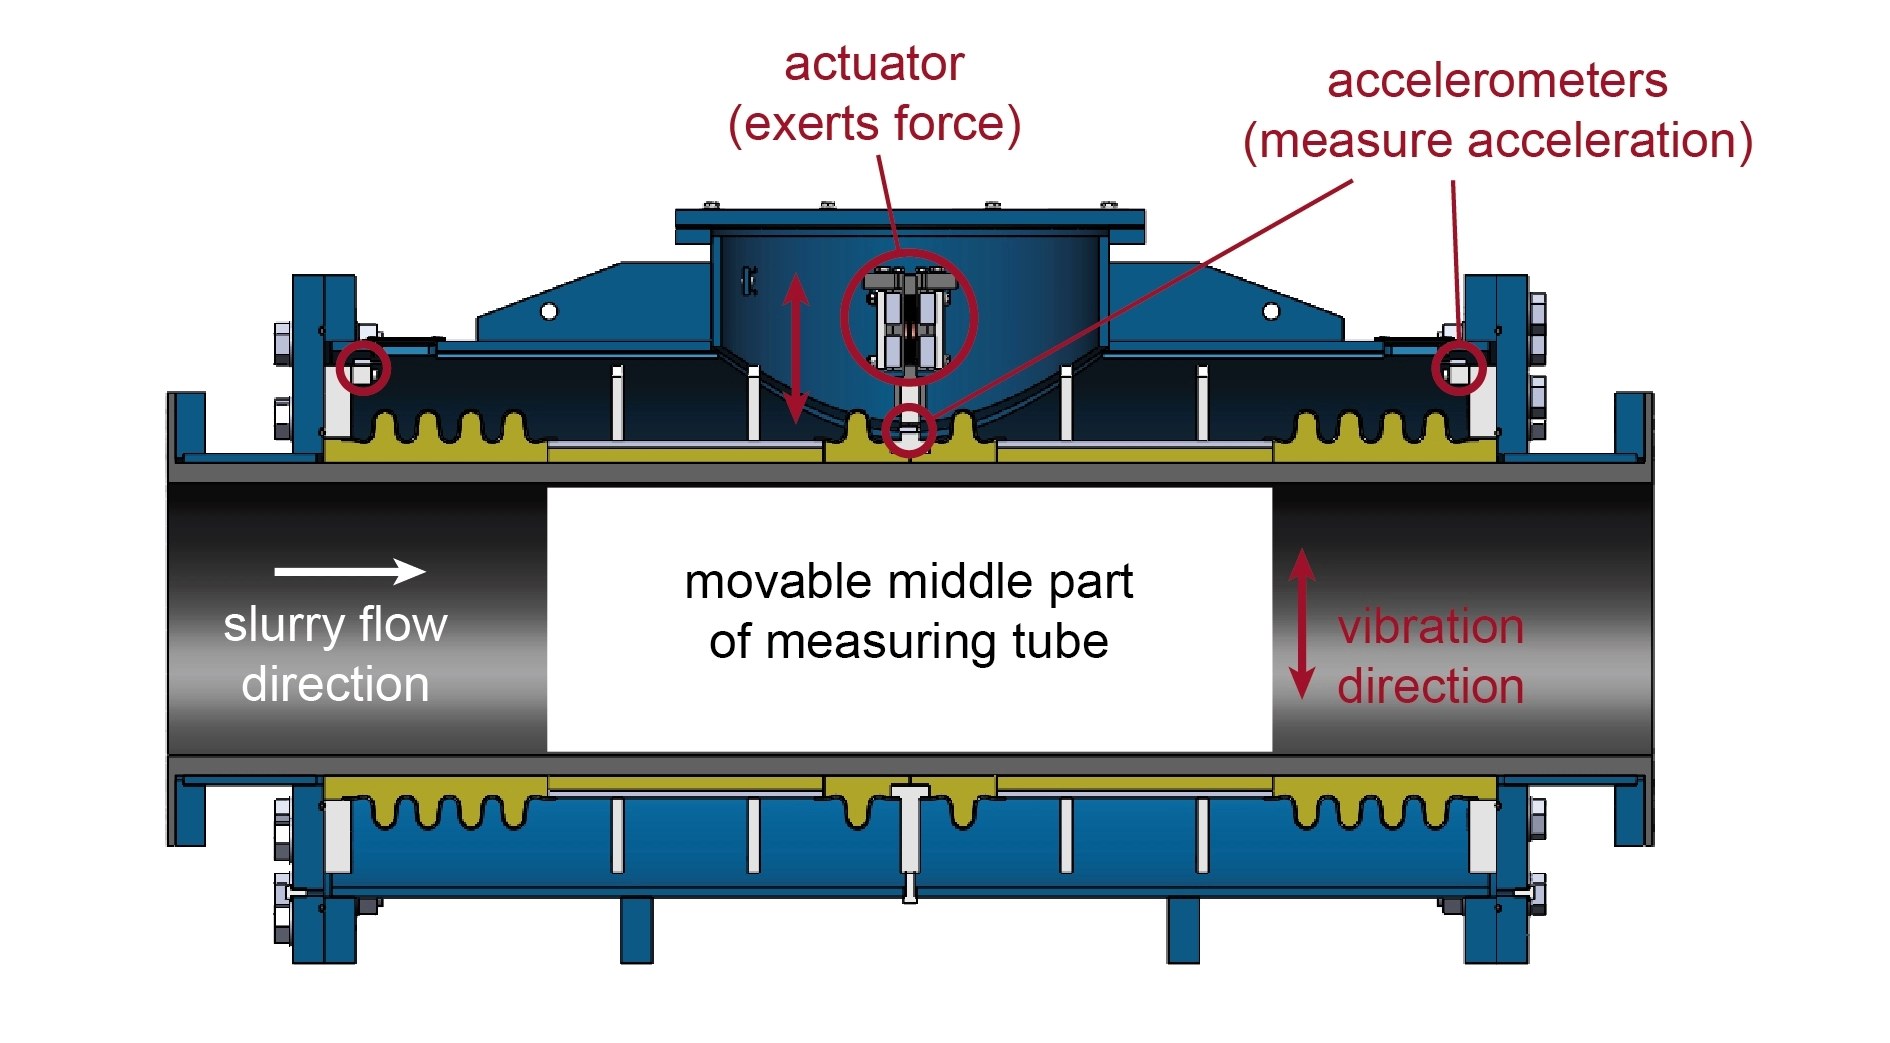
Production monitoring: turning density and velocity into reliable output tracking
If you’ve ever had a client meeting where everyone argues about “production,” you already know why production measurement matters. Offshore dredging often involves long discharge routes and changing soil conditions. Visual judgment is unreliable, and manual sampling is slow.
Production monitoring becomes meaningful when it can translate slurry behavior into a real-time output estimate. In practice, this usually means combining flow indication with density measurement to estimate solids rate, then trending it over time to identify what “normal” looks like for a given soil type and pipeline configuration.
What makes this “intelligent” is not the equation itself. It’s the context. If solids rate drops while discharge pressure climbs, that’s not just “lower production.” That’s a signature—often pipeline head loss growth or settling behavior. If solids rate drops while suction becomes noisy and unstable, that’s a different signature—often air ingress or NPSH margin issues.
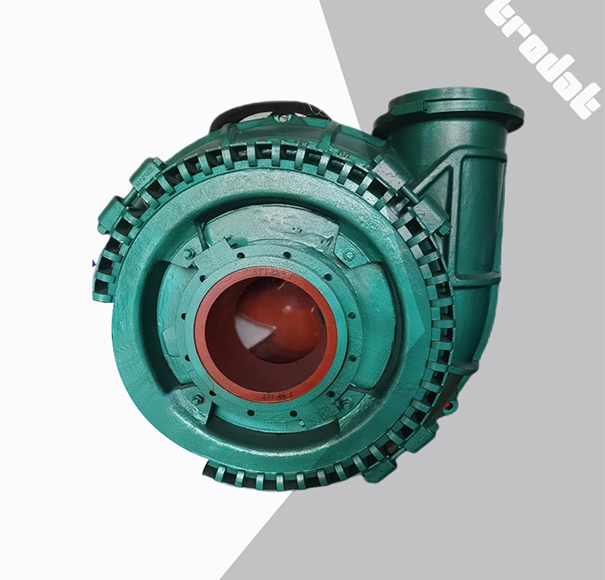
Pump and powertrain health: pressure, vibration, temperature, and efficiency drift
Offshore dredging pumps live a hard life. Abrasive slurry and long running hours wear internal surfaces. Bearings and seals see load, temperature, and contamination challenges. Over time, a pump that once had margin loses head and efficiency. That performance loss often shows up first as “distance not reached” or “production drops unless we lower density.”
A practical monitoring approach looks at discharge pressure trends, suction stability, drive speed, and power draw patterns. When the system is healthy, these move in recognizable relationships. When the system is deteriorating, those relationships change. The crew can feel it, but monitoring gives them the proof—useful when deciding maintenance timing offshore, when spare parts and crane time are limited.
Pipeline condition: pressure profile, head loss growth, and early blockage signals
Long discharge pipelines are not passive. They’re dynamic systems that change with operating conditions. Slurry velocity, concentration, particle size distribution, pipeline internal roughness, bends, reducers, and elevation changes all influence losses. If you only monitor a single pressure gauge at the pump, you can miss what’s happening down the line.
A better approach is to monitor the pipeline as a system by watching a pressure profile or at least comparing pressure at two points. When a pipeline begins to settle, the “extra loss” often grows over hours, not seconds. If you can see that growth early, you can intervene while the line is still recoverable—adjust operating point, flush a section, or change density strategy—rather than waiting for a plug that costs half a shift.
This is where slurry pipeline pressure drop troubleshooting becomes actionable. The crew is not guessing whether it’s the pump or the line. They’re reading signatures: pressure rising, flow falling, density drifting, and the time pattern of each.
Positioning and dredging accuracy: navigation, track control, and cut consistency
Offshore dredging is not only about pumping. It’s about removing the right material from the right place, with acceptable tolerances and minimal rework. Navigation data, track alignment, and logging matter because they influence cutter load, suction behavior, and even pipeline stability. If the dredger repeatedly overcuts in a hard patch, the cutter torque and suction conditions can fluctuate, and those fluctuations can show up as unstable flow or pressure oscillations.
A monitoring mindset connects these dots. If production drops, you don’t only look at the pump. You also look at whether the dredger’s cut pattern changed, whether the vessel’s positioning drifted, or whether cutter interaction with the seabed became more aggressive.
Environmental compliance offshore: turbidity and discharge indicators that support reporting
Many offshore projects are increasingly constrained by environmental requirements. Monitoring turbidity, overflow conditions, or other environmental indicators is not just “paperwork.” It helps avoid stop-work events and supports compliant operation.
In practical terms, this often means capturing data that can be reported without manual reconstruction later. Offshore crews benefit when reporting is automatic, consistent, and aligned with the way regulators and clients review compliance. That reduces administrative friction and keeps attention on production and safety.
A field-ready system architecture for offshore dredging monitoring
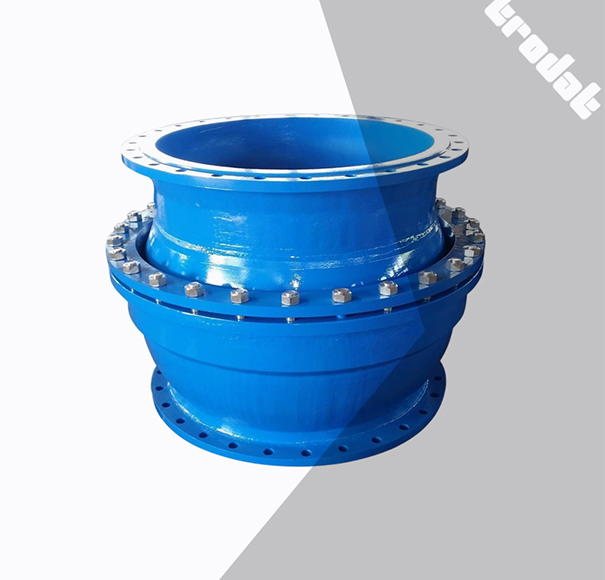
Sensors and instruments: what to measure, where to measure, and why placement matters
Instrumentation offshore needs to survive vibration, humidity, salt exposure, and mechanical abuse. More importantly, it needs to be placed where it produces usable signals. A flow meter in a poor location can be worse than no flow meter because it adds false confidence.
Good placement decisions are usually simple: capture pressure where it represents system behavior, measure density where the slurry is well mixed, and avoid locations where entrained air or flow disturbance makes readings unstable. Offshore, stability beats perfection. A stable trend line is more useful than a “high-accuracy” device that drifts or fails.
Edge collection and onboard logic: alarms, thresholds, and fail-safe modes
Offshore links can drop. Even when satellite is available, latency and bandwidth are not always friendly. A practical dredging monitoring system therefore needs onboard logic, not just cloud dashboards.
This means alarms and thresholds that run locally. If discharge pressure spikes rapidly, the crew needs an immediate alert, not an email ten minutes later. If density collapses while suction becomes unstable, the operator needs a clear signal that something has changed. Offshore crews respond well to alarms that are tied to operational meaning, not generic “high-high” tags.
Connectivity offshore: what to do when links drop
Remote monitoring is valuable offshore because decision-makers and technical support are often not on the vessel. But remote monitoring only works when the system is designed for intermittent links.
The practical approach is store-and-forward logging, local visualization onboard, and a remote view that can recover quickly after an outage. In other words, the dredger should continue running safely with local control even when connectivity is reduced, and the system should rebuild a coherent record when the link comes back.
Data integrity: calibration cycles, noise, and “bad data” scenarios
Offshore crews tend to distrust data when it burns them once. A sensor that drifts for a week and then is “fixed” without explanation creates long-term skepticism. That skepticism kills adoption.
Data integrity is therefore operational, not theoretical. Calibration routines need to be realistic. Noise filtering needs to avoid hiding real events. And when data is bad, the system should say so. Clear status indicators—healthy, suspect, offline—build trust and help crews make better decisions.
Practical workflows crews actually use on offshore projects
Start-up and ramp-up: stabilizing flow before pushing concentration
Many offshore pipeline incidents begin at start-up. Starting a long discharge line too aggressively can create unstable flow, local settling, or pressure surges. A practical start-up approach is about controlling the transition: establish stable flow, confirm pressure behavior, then gradually increase density.
A monitoring system supports this by showing whether the system is stabilizing or drifting. If discharge pressure spikes while flow remains low, the crew knows they’re pushing against resistance. If density rises while velocity is marginal, the crew can see they are approaching settling conditions.
Daily production management: shift-to-shift benchmarking that crews accept
Offshore production is rarely constant. Soil changes, sea state changes, and route changes affect performance. What crews need is a way to compare “today” to “yesterday” in a meaningful way, not just a raw cubic meter number.
A practical benchmark is a baseline signature for a given operating condition—how discharge pressure, speed, density, and solids output relate when the system is healthy. When those relationships shift, you have an early warning. The crew can then adjust before the shift turns into a recovery operation.
Troubleshooting during operation: diagnosing patterns, not single numbers
Troubleshooting offshore is about pattern recognition. The question is rarely “is the pressure high?” The question is “why is pressure changing this way?”
If pressure rises slowly over hours while flow drops, that often suggests increasing pipeline losses, maybe from settling or buildup. If pressure oscillates rapidly, you may be dealing with entrained air, control instability, or water hammer risk. If suction becomes unstable and noise increases, cavitation margin may be shrinking.
Monitoring helps crews see these patterns, and it helps technical support teams give better advice when they are remote. Instead of “try this,” the conversation becomes “your pressure curve and density trend look like settling; adjust velocity first, then rebuild density.”
Predictive maintenance: catching wear and cavitation before distance collapses
Wear doesn’t announce itself politely. It often shows up as reduced head, reduced efficiency, and a loss of margin. Offshore, that loss of margin is what turns a manageable disturbance into an outage.
When monitoring trends are used as early indicators, maintenance becomes proactive rather than reactive. If the system shows that achieving the same solids output now requires higher pressure and higher power than it did two weeks ago, something has changed. That “something” is commonly wear, internal clearance growth, or pipeline roughness increase. The sooner you catch it, the more options you have offshore.
Incident prevention: water hammer risk and controlled response
Pressure surges are not abstract. They stress pipelines, joints, and hoses. In offshore work with long lines, sudden valve actions or abrupt speed changes can create destructive transients. A monitoring system that captures fast pressure changes and flags abnormal spikes is a safety tool as much as a production tool.
It also supports training. When crews see how certain actions cause pressure behavior, operations improve. Offshore, that learning loop matters.
Three real offshore scenarios and the monitoring signals that solve them
“Production drops but pump pressure rises”: reading pipeline head loss growth
This scenario is common on long lines. At the start of a run, discharge pressure and solids output look healthy. Over days, discharge pressure trends upward. Operators may respond by lowering density to keep the line from plugging. Production drops anyway.
Monitoring helps by separating cause from symptom. When pressure rises while solids output falls, and the pattern is gradual, the system is often experiencing increasing pipeline losses. That can come from subtle settling behavior, buildup in a low-velocity zone, or a route change that added fittings or elevation.
In practice, the corrective action is often about restoring velocity margin first, then rebuilding density. If velocity stays marginal, any increase in concentration may increase friction and risk settling. Offshore, a measured approach keeps the line stable and prevents a full blockage event.
“Discharge distance not reached at the same pipeline length”: wear versus settling versus air ingress
Crews often notice this as a frustrating change: “We used to run this route. Now we can’t.” Same pipeline length, similar soil, but distance falls short.
Monitoring signatures help narrow it down. If suction stability deteriorates and there are signs of entrained air, you may be dealing with air ingress or suction-side issues. If power draw increases while output falls, you may be off the pump’s healthy operating point or suffering efficiency loss due to wear. If the problem shows up mainly at higher density, and pressure climbs while flow drops, settling risk may be dominating.
Without monitoring, this becomes a debate. With monitoring, it becomes diagnosis.
“Good output at low density, unstable at high density”: finding the critical velocity boundary
This is a classic critical velocity problem. At low density, the line moves well. As concentration increases, the line becomes unstable and sanding begins. Operators then back off density and the line recovers.
A practical interpretation is that the system’s velocity margin is too narrow for the material at that operating point. Offshore, the goal becomes maintaining a transport regime that stays above the settling threshold. That can involve adjusting speed, adjusting production strategy, or revisiting pipeline configuration.
Monitoring supports this by showing exactly where instability begins—what density, what pressure, what flow pattern. Once you can see the boundary, you can run near it without crossing it.
How monitoring supports long-distance pumping and booster station decisions
When data proves you’re head-limited versus velocity-limited
Long distance dredging pumping fails for different reasons. Sometimes the system is head-limited: the total head demand exceeds what the pump system can provide with margin. Sometimes it’s velocity-limited: you can generate pressure, but you can’t maintain a non-settling velocity regime for the material.
Monitoring makes that distinction clearer. If pressure is high but solids output is low and velocity is marginal, you’re often velocity-limited. If pressure approaches limits while output remains modest and any increase in output drives pressure to a ceiling, you may be head-limited.
That distinction matters because it changes the solution. Head-limited systems often require equipment or configuration changes. Velocity-limited systems may be improved by operational changes, route adjustments, or pipeline configuration changes, and sometimes by adding staged pumping.
Booster station triggers: pressure margins, stability windows, and energy trade-offs
A booster pump station is not simply a way to “push further.” Offshore, it can widen the stable operating window. It can help maintain velocity and reduce the constant need to dilute slurry. It can also reduce the stress placed on the main dredging pump by distributing head across stages.
Monitoring supports booster decisions by making the margin visible. If the system can only run without incident when density is kept low, and if pressure and output trends suggest you are operating near the limit day after day, you are paying an ongoing operational penalty. At that point, a booster station can be a schedule tool, not just a mechanical add-on.
Commissioning booster plus cutter pump coordination: sequences, interlocks, and alarms
When staged pumping is used offshore, coordination matters. Start-up sequences, interlocks, and alarm logic become part of safe operation. Monitoring data supports commissioning because it provides evidence of stability: pressure transitions, flow recovery, and density behavior during start-up and shutdown.
Without a coherent monitoring picture, staged systems can feel unpredictable. With the right data, they become manageable.
Offshore implementation checklist: what to standardize before mobilization
Instruments by project type and what “minimum viable monitoring” looks like
Offshore monitoring choices should reflect project risk. A reclamation job with long discharge lines and variable soil calls for production and pipeline condition visibility. A channel dredging job with tight tolerances may emphasize navigation and cut logging. Environmental constraints may elevate turbidity monitoring and reporting.
The key is not to add everything. It’s to standardize the measurements that prevent the failures you can’t afford offshore.
Commissioning tests that pay off later
A baseline pressure map along the line, a baseline production signature at standard conditions, and a known-good set of alarm thresholds make troubleshooting faster later. When something changes offshore—and it will—you have a reference point. That reference point is what turns monitoring data into decision support rather than noise.
Reporting that clients accept and crews can use
Offshore reports should not be written like academic papers. They should support decision-making and compliance. If reporting is too heavy, crews avoid it. If it’s too light, clients challenge it. Monitoring systems that support simple, consistent daily outputs—production trends, downtime reasons, key parameter ranges—reduce friction and improve trust.
Practical access control and operational safety
Monitoring systems increasingly connect people onshore to operations offshore. Access control is not about making life difficult; it’s about preventing accidental changes and maintaining a clear responsibility chain. Offshore projects run better when the system has clear roles—viewing, advising, controlling—without confusion.
TRODAT (SHANDONG) MARINE ENGINEERING CO., LTD: a brief introduction
TRODAT (SHANDONG) MARINE ENGINEERING CO., LTD supports dredging and marine engineering projects by supplying equipment modules and project-oriented solutions that cover both core dredging functions and supporting systems. According to the company’s introduction, the scope includes dredging-related equipment, deck machinery, and specialized systems that can be configured to match different project requirements. The product and solution scope described by the company also includes monitoring and measurement-oriented capabilities such as sediment production measurement and navigation-related systems, alongside mechanical modules used in dredging operations.
If your offshore project is planning an intelligent monitoring approach, the most useful starting point is often to define the critical measurements and the environment they must survive—salt exposure, vibration, limited maintenance windows, and intermittent connectivity—then select the instrumentation and system integration approach accordingly. For readers who want to see the relevant category on the TRODAT site, you can reference [monitoring instruments] here.
Conclusion
Offshore dredging doesn’t reward “we’ll figure it out later.” Distance, weather, and limited repair options make small process weaknesses costly. A practical intelligent dredging monitoring system helps crews run with fewer surprises by turning key signals—production indicators, pump and powertrain behavior, pipeline pressure patterns, positioning data, and compliance metrics—into operational decisions. It won’t eliminate challenges offshore, but it changes the game: problems show up earlier, root causes become clearer, and interventions become calmer and faster. Over a multi-week job, that stability is often what protects schedule, cost, and equipment health.
FAQs
Why do offshore dredging projects need an intelligent dredging monitoring system instead of manual checks?
Manual checks are slow and often inconsistent offshore, especially when conditions change within a shift. A dredging monitoring system provides continuous trends for pressure, flow behavior, and production indicators, so crews can detect drift early and respond before pipeline losses or settling turn into downtime.
How do I know if my long distance dredging pumping problem is head-limited or velocity-limited?
If discharge pressure approaches a ceiling while production gains are small, the system is often head-limited. If pressure is available but the line becomes unstable or starts to sand up when density rises, it’s often velocity-limited. Monitoring trends—especially pressure patterns and production indicators—help separate these cases without guesswork.
What causes slurry pipeline pressure drop to get worse over time during offshore dredging?
Pressure drop typically worsens when pipeline head loss increases due to buildup, settling in low-velocity zones, route changes adding fittings or elevation, or internal roughness growth. It can also worsen when the pump’s effective head declines from wear, which reduces margin and makes the pipeline more sensitive to operating changes.
How can monitoring instruments help prevent pipeline blockage in offshore dredging?
Monitoring instruments can highlight early warning signs such as rising discharge pressure paired with falling production indicators, unstable suction behavior, or recurring oscillations during density ramp-up. When crews see these signals early, they can adjust operating point and restore a stable transport regime before a blockage forms.
When should I consider a booster station based on monitoring data?
If the system can only stay stable by running low density, if pressure margins shrink over time, or if reaching target production repeatedly pushes the pump system near its limit, monitoring data may indicate that staged pumping is needed. A booster station decision is strongest when trends show chronic lack of margin rather than a one-time disturbance.
Post Comment